Despite economic headwinds in recent years, including high prices and interest rates, one bright spot has been a surge in new businesses. Across cities nationwide, aspiring and existing entrepreneurs are launching businesses at rates not seen in recent history. This trend defies pressures from high operational costs and limited access to capital, signaling a wave of innovation and adaptability.
Many of these new ventures are born out of necessity—a reminder that challenging times often inspire fresh ideas and creative solutions. Whether driven by shifts in the labor market, evolving consumer needs, or a desire for greater autonomy, entrepreneurs across a wide range of industries have turned obstacles into opportunities and are reshaping local economies in the process.
New Business Applications Over Time
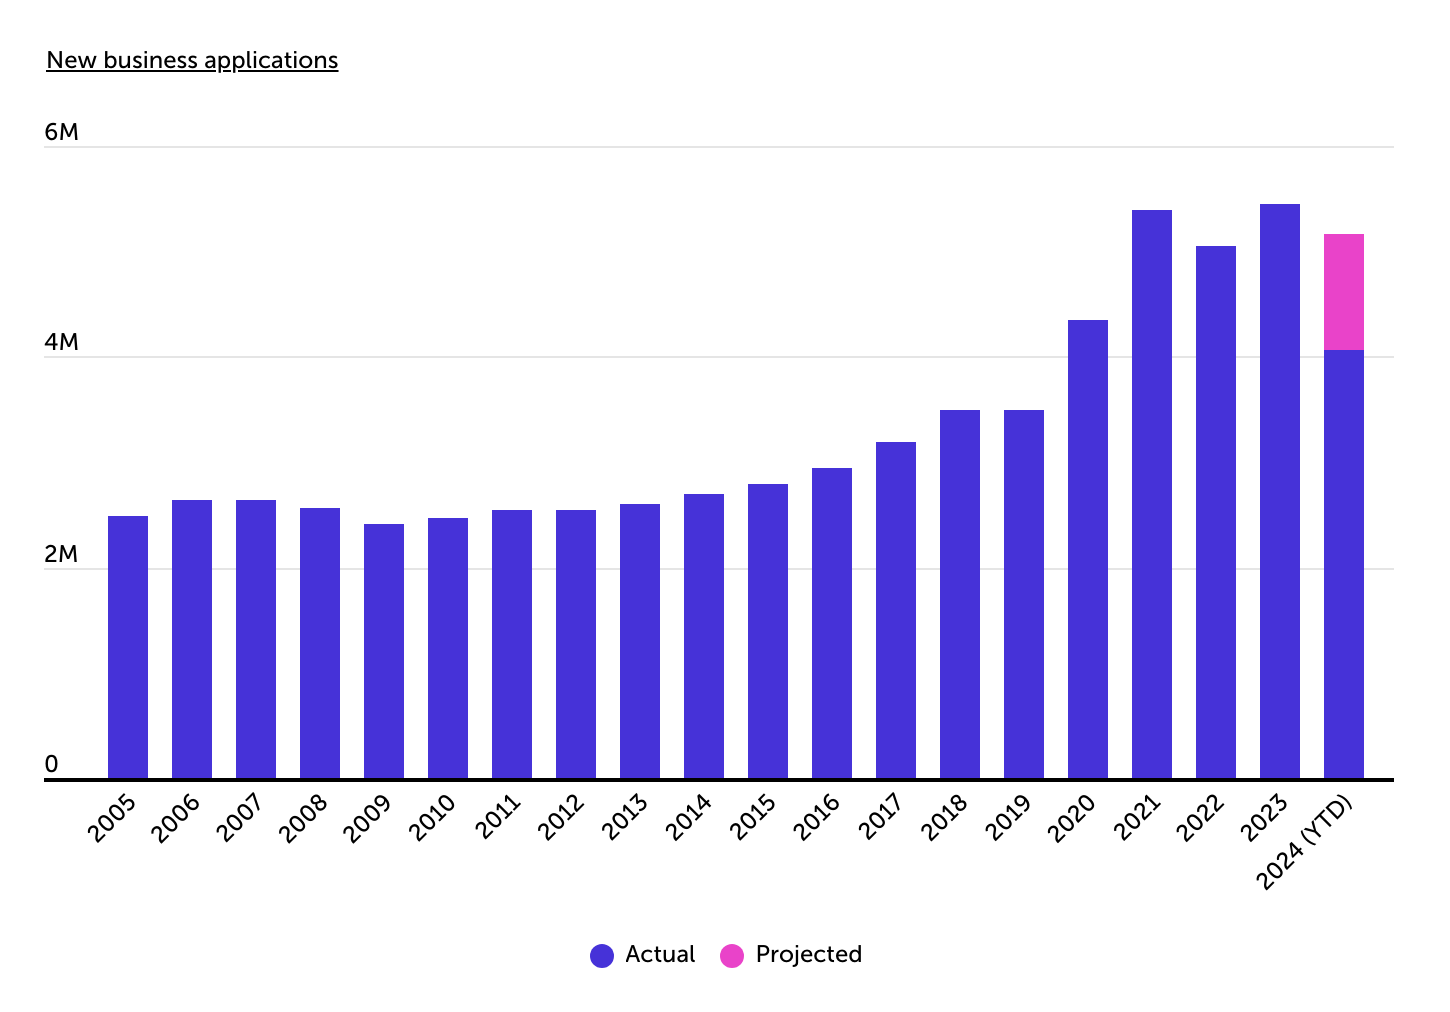
After rapidly rising during COVID, new business applications remain elevated
Source: Simply Business analysis of U.S. Census Bureau data | Image Credit: Simply Business
New business applications have surged to unprecedented levels over the past five years. For much of the 2000s and 2010s, business applications hovered between 2.5 million and 3.5 million annually. In 2020, however, applications spiked dramatically, reaching 4.35 million—a roughly 25% increase from the previous year. This trend accelerated further in 2021, with applications exceeding 5.3 million, and has since stabilized.
The economic shifts brought on by the pandemic spurred a renewed wave of entrepreneurship, fueled by the rise of remote work, digital transformation, and shifting consumer demands. Despite inflation and increased borrowing costs since 2022, applications have continued to exceed pre-pandemic norms, with 5.45 million applications filed in 2023. Early 2024 figures show a potential year-end total near 5.2 million.
New Businesses Applications by Industry
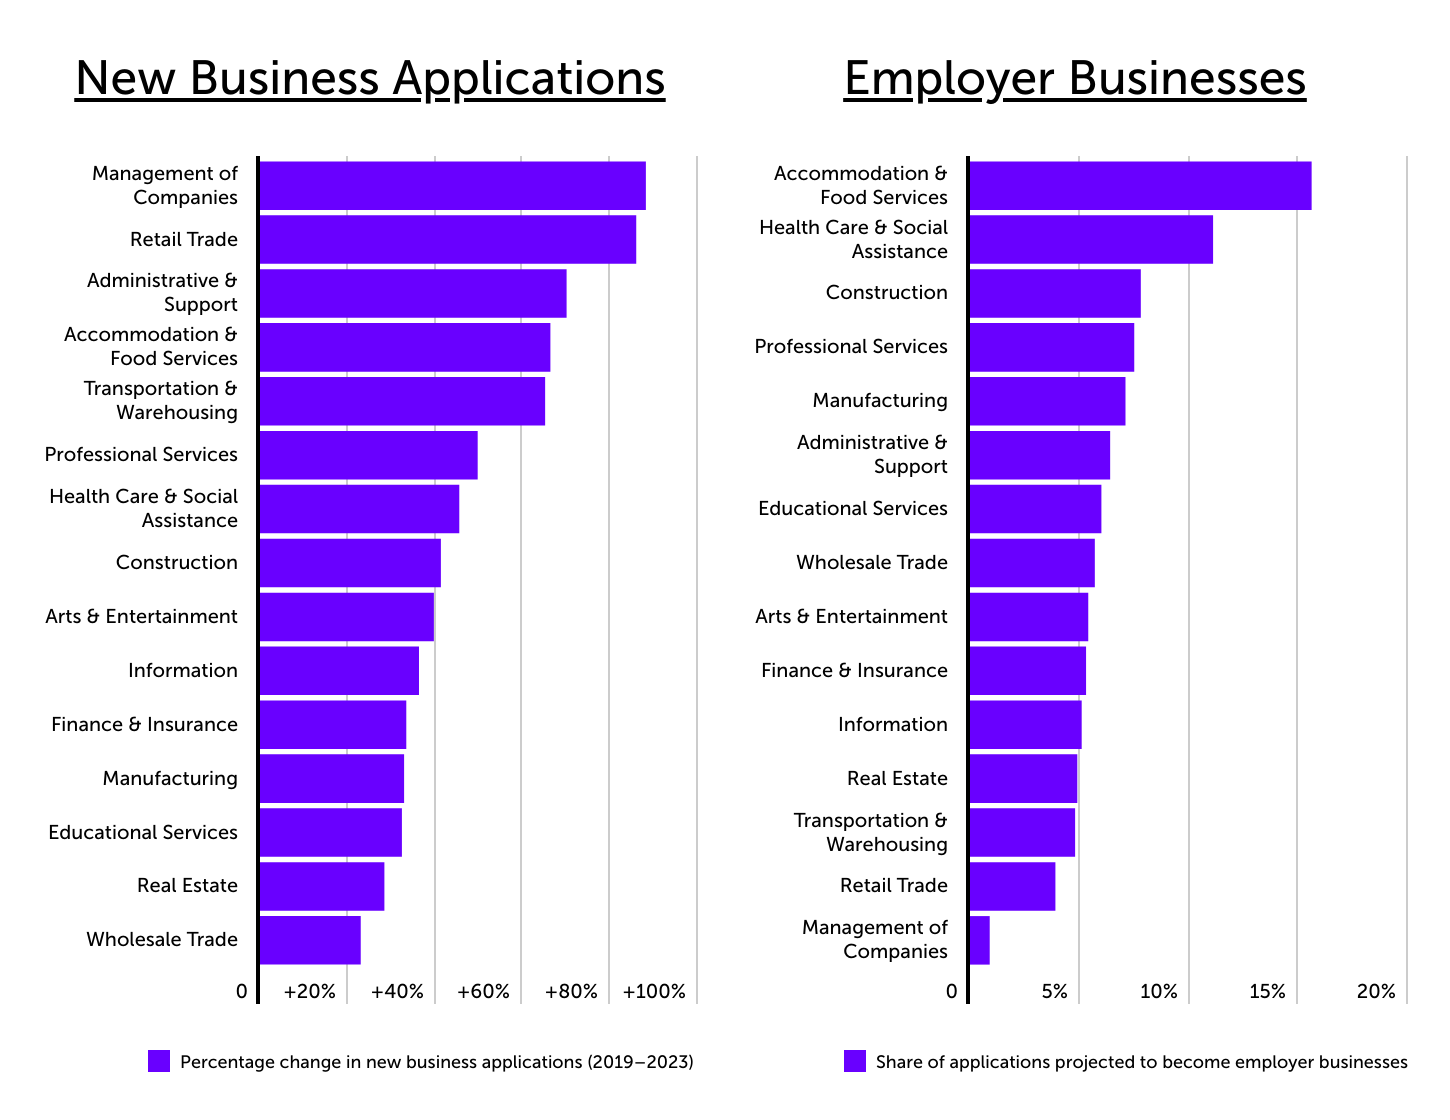
Holding companies, retail see largest growth in new business applications
Source: Simply Business analysis of U.S. Census Bureau data | Image Credit: Simply Business
Across the 15 largest industry sectors, management of companies and retail trade have experienced the most significant growth in new business applications since 2019—indicating strong opportunities for aspiring entrepreneurs in those areas of the economy. Applications in the management of companies sector, which includes holding companies and corporate offices, rose by 88.1% from 2019 to 2023. Retail trade followed closely, with an 85.9% increase, indicating strong entrepreneurial activity in these areas. Other industries seeing significant growth include administrative and support services (up 70%), accommodation and food services (66.3%), and transportation and warehousing (65.1%).
While certain sectors show high growth in applications, some are more likely than others to convert these applications into employer businesses. Among the top industries, accommodation and food services leads, with 15.6% of its new business applications projected to become employer businesses. Health care and social assistance follow at 11.1%, with construction (7.8%), professional services (7.5%), and manufacturing (7.1%) rounding out the list. By contrast, management of companies, despite its significant growth, has a lower conversion rate, with only 0.9% of applications expected to become employer businesses.
Geographical Differences in New Business Applications
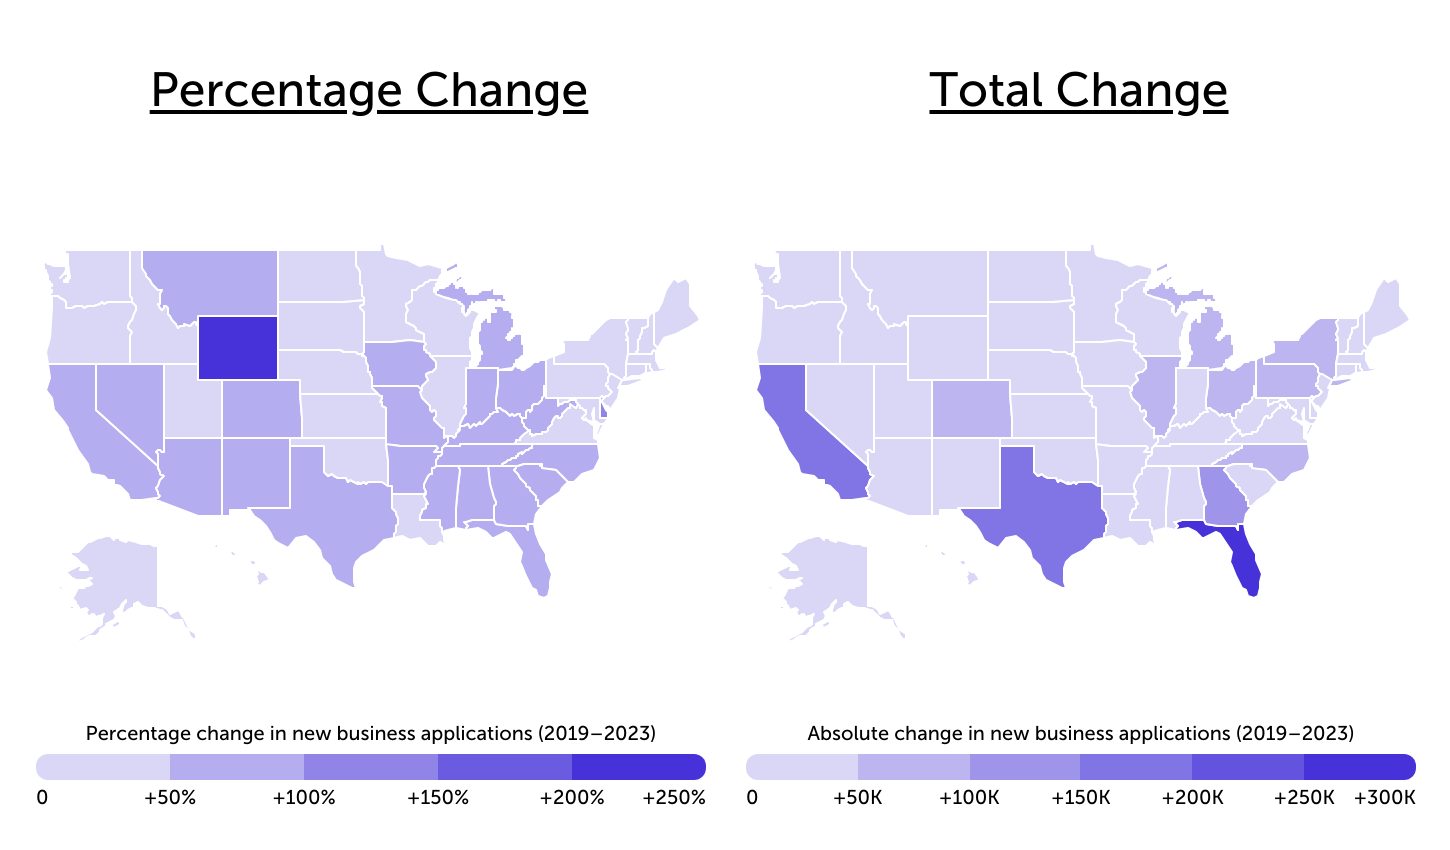
Business-friendly states Wyoming and Delaware see the biggest surge in new business applications
Source: Simply Business analysis of U.S. Census Bureau data | Image Credit: Simply Business
At the state level, Wyoming and Delaware stand out for their growth in business applications. Wyoming business applications more than tripled between 2019 and 2023, resulting in an additional 39,609 applications. Delaware business applications grew by 113%, adding 29,244 new applications. Both states are known for business-friendly policies, encouraging people to incorporate and start businesses there.
Outside of Wyoming and Delaware, states in the southern half of the country generally recorded larger increases in new business applications than those in the Northeast, Pacific Northwest, or Midwest. Leading Sun Belt states include New Mexico (+92.1%), South Carolina (+77.9%), Alabama (+72.2%), and Florida (+69.5%). New business applications in Texas also posted an above-average increase of 63.4%. These states tend to have either favorable tax rates, privacy laws, filing requirements, or some combination of the three that make them appealing to business owners.
At the local level, these geographic patterns are less distinct, reflecting variations in local economies. For example, several California metropolitan areas rank highly despite California as a state recording below-average growth in business applications. Among the nation’s largest metropolitan areas, Sacramento, CA (+127.8%) and Fresno, CA (+101.1%) ranked first and second, with Riverside, CA (+80.4%) ranking fourth. Rounding out the top five were Tampa, FL and Indianapolis, IN. Tampa business applications increased by 84% between 2019 and 2023, while Indianapolis business applications grew by 77.5%.
Understanding which areas are experiencing new business growth is useful for both current and aspiring business owners. High-growth areas often reflect favorable conditions such as supportive local policies, growing populations, and affordability, which can impact a business’s chances of success. This information allows business owners to assess where opportunities may be strongest based on recent activity.
This analysis was conducted by Simply Business—a small business insurance marketplace—using 2019 and 2023 data from the U.S. Census Bureau. Researchers ranked locations based on the percentage change in new business applications between the annual figures for 2019 and 2023.
Here is a summary of the data for Maryland:
- Percentage change in new business applications (2019–2023): +34.8%
- Absolute change in new business applications (2019–2023): +26,250
- New business applications in 2019: 75,467
- New business applications in 2023: 101,717
- Estimated employer businesses created from 2019 applications: 3,866
- Estimated employer businesses created from 2023 applications: 4,596
For reference, here are the statistics for the entire United States:
- Percentage change in new business applications (2019–2023): +55.8%
- Absolute change in new business applications (2019–2023): +1,952,088
- New business applications in 2019: 3,498,833
- New business applications in 2023: 5,450,921
- Estimated employer businesses created from 2019 applications: 280,716
- Estimated employer businesses created from 2023 applications: 354,090
For more information, a detailed methodology, and complete results, see Cities Experiencing a Surge in New Business Applications on Simply Business.


